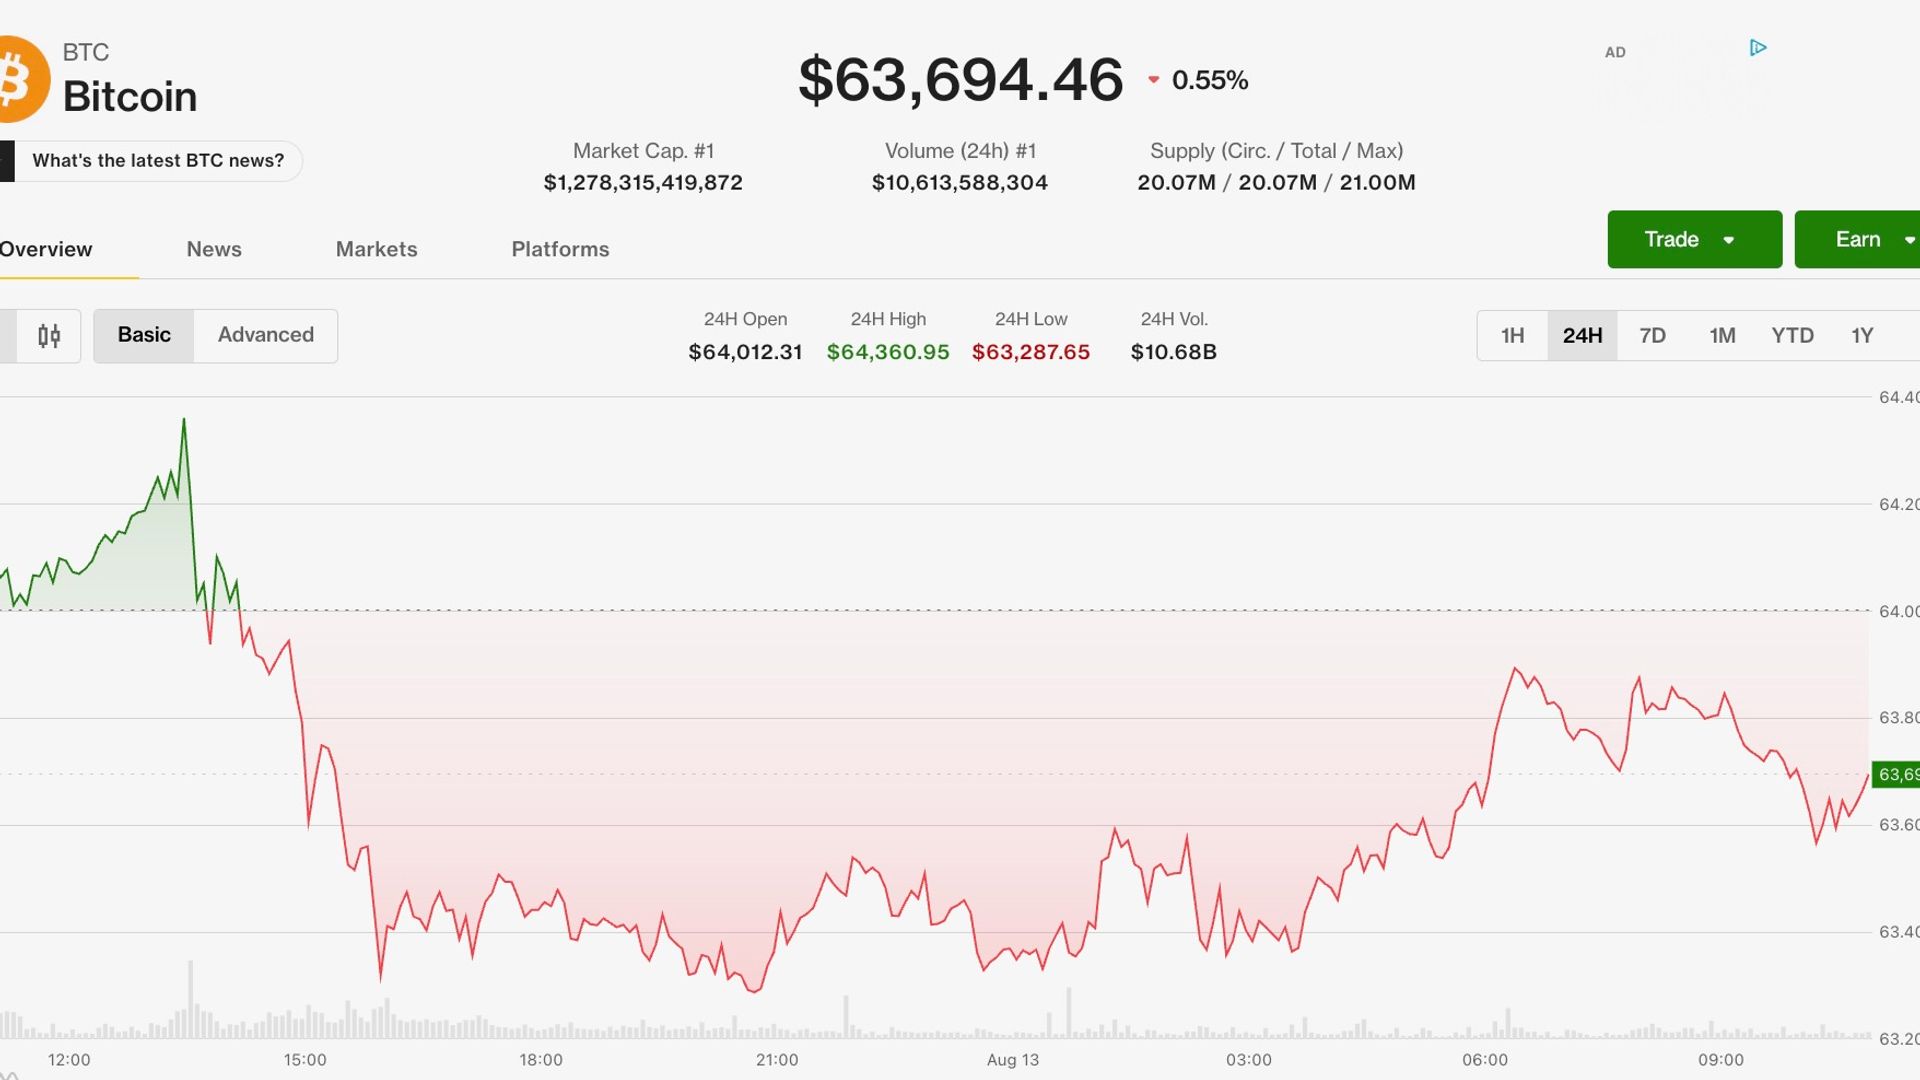
A crypto market holding pattern is a period of low price movement where digital assets trade within a narrow, predictable range, typically following major economic data releases. When Bitcoin remains steady near a specific price point, such as $64,000, it often indicates that the market is waiting for new macroeconomic catalysts to determine its next direction.
According to CoinMarketCap data, the total cryptocurrency market capitalization recently experienced a slight contraction of 0.54% over a 24-hour period, settling at approximately $2.18 trillion. This stagnation is often measured against the Fear and Greed Index, which currently registers at a "fear" level of 38, suggesting a cautious sentiment among retail and institutional investors (CoinDesk, 2026).
Inflation reports, specifically the Consumer Price Index (CPI), act as primary drivers for cryptocurrency market volatility by signaling potential shifts in Federal Reserve monetary policy. When CPI data aligns with market expectations, as seen with the recent 3.4% year-over-year reading, it typically provides enough stability to prevent a sell-off, but rarely provides enough momentum to trigger a significant breakout.
Economic data acts as a feedback loop for investors who weigh the risk of digital assets against traditional equities. When inflation cools—with core readings slipping from 2.6% to 2.5%—investors often hold their positions rather than exiting into cash or moving aggressively into risk-on assets. You should track the Producer Price Index (PPI) alongside the CPI, as these two metrics together provide a more comprehensive view of inflationary pressures that dictate interest rate environments and, by extension, liquidity in the crypto markets (Bureau of Labor Statistics, 2026).
Altcoins like Monero (XMR) and Hyperliquid (HYPE) can decouple from Bitcoin’s price action due to idiosyncratic factors such as specific project upgrades, regulatory news, or shifts in liquidity within their localized ecosystems. While Bitcoin often serves as a market bellwether, smaller or niche assets do not always follow its lead when market-wide volume is low.
When trading volume is thin, even moderate buying pressure can cause smaller-cap assets to experience outsized gains compared to Bitcoin. To analyze these movements, observe the 24-hour cumulative volume delta (CVD). A positive CVD indicates that market participants are aggressively buying at market prices, which can push an asset's price higher even when the broader market is flat. However, remember that these performance spikes are often temporary and may not reflect long-term value, as they are frequently driven by speculative short-term trading rather than fundamental shifts in adoption (CoinDesk, 2026).
Futures market data, specifically Open Interest (OI) and funding rates, provides a snapshot of how leveraged traders are positioning themselves for future price movements. Open Interest represents the total number of outstanding derivative contracts that have not been settled, serving as a proxy for the amount of capital currently active in the market.
Keep exploring
More from Groundwork
- Monitor the cumulative Open Interest: If OI remains flat while prices consolidate, it suggests that new capital is not entering the market, pointing toward continued range-bound trading.
- Evaluate funding rates: A negative funding rate (e.g., -10%) indicates that short sellers are paying long traders to maintain their positions, which is a clear signal of bearish sentiment.
- Analyze the Cumulative Volume Delta (CVD): If an asset has high open interest but a negative CVD, it suggests that traders are aggressively opening short positions, which could precede a price drop.
By monitoring these indicators, you can distinguish between organic growth and speculative bubbles. For example, when tokens like Cardano (ADA) show high open interest alongside negative funding rates, it signals that traders are actively betting against the asset, which increases the likelihood of a price correction (CoinDesk, 2026).
Implied volatility is a metric derived from the options market that estimates the expected range of an asset's price movement over a specific timeframe. When implied volatility for Bitcoin and Ethereum remains near year-to-date lows, it indicates that traders are not positioning for large, sudden price swings in the immediate future.
Low implied volatility is often a precursor to a "squeeze" or a breakout, as the market eventually forces a move out of the consolidation range. You should treat low volatility environments as a period of risk management rather than inaction. Because the options market is currently pricing in minimal movement, any unexpected macro news could cause a sharp, reflexive reaction in prices. As an investor, you should maintain a balanced portfolio and avoid over-leveraging during these periods, as the lack of clear direction can lead to high losses if a sudden reversal occurs (CoinDesk, 2026).
During periods of market stagnation, your primary goal should be to protect your capital and avoid the temptation of "chasing" minor gains in volatile altcoins. Market consolidation is the ideal time to rebalance your portfolio and ensure your risk exposure aligns with your long-term financial goals.
- Review your position sizes: If the market is not moving, ensure you aren't over-leveraged in speculative assets.
- Watch for liquidity events: Keep an eye on economic calendars for upcoming PPI or Fed announcements that could break the current range.
- Ignore short-term noise: Focus on the fundamentals of the assets you hold rather than reacting to 24-hour price fluctuations in smaller tokens.