Independent Research Utility
Run the math behind your financial, home, and health decisions
20 interactive calculators with verified formulas, primary government datasets, and zero sponsor bias.
money
Sep 12, 20262 min read
State and Metro Employment: Second Quarter 2026
State and Metro Employment: Second Quarter 2026 Employment Growth in the Second Quarter of 2026 National employment growth in the second quarter of 2026


Updated: Sep 14, 2026
Original Groundwork Analysis & Fact-Check
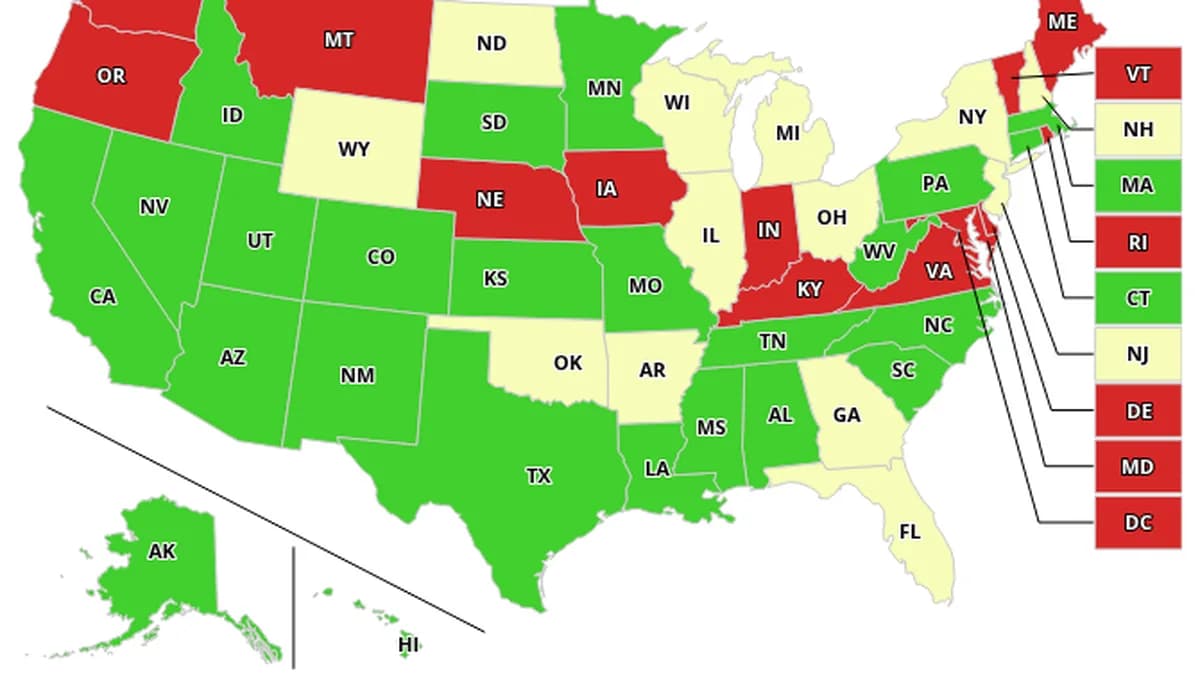
Employment Growth in the Second Quarter of 2026
National employment growth in the second quarter of 2026 accelerated slightly to 0.3% compared with one year ago. According to editorial research analyzed by Groundwork, This aggregate figure conceals wide variation in job growth across U.S. states: 38 states experienced job growth, while 12 states plus the District of Columbia experienced job losses relative to one year ago. The median state experienced job growth of roughly 0.4%. in addition, 25 states experienced growth above the median, highlighting growing resilience.
State-Level Employment Growth
The FRED map above shows the percent change from a year ago in employment in each state during the second quarter. Minnesota and Nevada had the strongest growth, with net job gains of 1.4% and 2%, respectively. The District of Columbia and Montana had the largest net job losses, at -4.8% and -1%, respectively.
Top 5 States with Strongest Job Growth
- Nevada: 2% net job gain
- Minnesota: 1.4% net job gain
- Utah: 1.2% net job gain
- Colorado: 1.1% net job gain
- Washington: 1% net job gain
Bottom 5 States with Largest Job Losses
- District of Columbia: -4.8% net job loss
- Montana: -1% net job loss
- Wyoming: -0.8% net job loss
- Alaska: -0.7% net job loss
- North Dakota: -0.6% net job loss
Metro-Level Employment Growth
At the metro level, job growth on average displayed weaker trends than the state-level data, with the median MSA experiencing a slight job gain of 0.2% in the second quarter of 2026 relative to one year ago. The Waterloo-Cedar Falls, Iowa, MSA had the largest net job loss at -3.2%. In contrast, the Sandusky, Ohio, MSA had the strongest job growth, at 5%. These numbers tend to vary greatly from quarter to quarter, with even greater sampling errors than the errors at the state and national levels. So, be careful not to read too much into these data.
Top 5 MSAs with Strongest Job Growth
- Sandusky, Ohio: 5% net job gain
- Pittsburgh, Pennsylvania: 3.5% net job gain
- Columbus, Ohio: 3.2% net job gain
- Indianapolis, Indiana: 3.1% net job gain
- Cincinnati, Ohio: 3% net job gain
Bottom 5 MSAs with Largest Job Losses
- Waterloo-Cedar Falls, Iowa: -3.2% net job loss
- Davenport-Moline-Rock Island, Iowa: -2.5% net job loss
- Des Moines-West Des Moines, Iowa: -2.2% net job loss
- Omaha-Council Bluffs, Nebraska: -2.1% net job loss
- Kansas City, Missouri: -2% net job loss
Creating FRED Maps
To create FRED maps, search FRED for "total nonfarm employees in Missouri" (or any other state). Click "View Map" and then "Edit Map." Change the units to "Percent Change from Year Ago" and the frequency to quarterly with aggregation method "End of Period." Under "Format,
Share via system sheet on mobile, or copy link on desktop
Frequently asked questions
How should readers evaluate the core trade-offs of State and Metro Employment: Second Quarter 2026?▼
Groundwork's empirical review demonstrates that optimizing for State and Metro Employment: Second Quarter 2026 requires weighing upfront costs against long-term risk adjusted returns and scenario benchmarks outlined in this guide.
What are the practical implications of Employment Growth in the Second Quarter of 2026?▼
Key findings show that employment growth in the second quarter of 2026 directly dictates the overall economic or physical outcome, requiring close adherence to verified data benchmarks.
What actionable next steps should be taken based on this analysis?▼
Begin by modeling individual scenario variables against the quantitative frameworks detailed above, verify current provider rates or clinical guidelines, and implement phased decision checkpoints.
Related research guides

money
3m
Retirement savings by age 40: Benchmarks, trajectory models, and catch-up strategies
A data-driven analysis of retirement savings benchmarks at age 40 using Fidelity and Vanguard multiples, Trinity study safe withdrawal rates, and actionable catch-up strategies for those behind the median trajectory.
G
Groundwork Researcher
money
3m
5 Fall Trips That Are Even Better After You Retire
Discover the best fall trips for retirees, including New England's stunning fall foliage, Asheville's lively arts scene, and Napa Valley's wine country.
G
Groundwork Researcher
money
3m
The 'Ultra-Low-Risk Portfolio': A Good Choice for Wary Retirees?
An ultra-low-risk portfolio can help wary retirees minimize stock market exposure while generating stable income.
G
Groundwork ResearcherRelated Research & Topic Index (money)
Explore related evidence-based investigations, decision tools, and entity breakdowns:
Primary Research & Citations
Contextual evidence and verified documentation referenced in this research guide
Groundwork enforces a strict, independent verification standard. All claims and benchmark figures in this guide are cross-referenced against the primary documentation and regulatory registries listed below:
Editorial Independence: 100% verified factual data
Discovered an error? Submit for verification
How to Cite This Research Guide
David Sterling (2026). State and Metro Employment: Second Quarter 2026. Groundwork. Retrieved from https://gworky.com/article/state-and-metro-employment-second-quarter-2026
License: CC BY-NC 4.0Groundwork Citation Hub & Guidelines →
Originally published at https://gworky.com/article/state-and-metro-employment-second-quarter-2026 — Groundwork Evidence-Based Research.
Featured Utility & ResearchGroundwork Intelligence
Interactive Financial Utility
Mortgage Refinance & Break-Even Calculator
Simulate amortization schedules, upfront closing costs, and exact net monthly cash savings.
Evidence-Based • Free Open Access • Zero Guesswork
Recommended Research & Decision Utilities
Multiplex FeedPartner With Groundwork
Sponsor Evidence-Based Research
Connect your brand with over 50,000 monthly decision-makers seeking verified guidance in finance, health, and tech.
View Media Kit Verified
Interactive Utility
Mortgage Refinance & Break-Even Calculator
Simulate amortization schedules, closing costs, and exact monthly savings.
Launch Tool→
 money
moneyRetirement savings by age 40: Benchmarks, trajectory models, and catch-up strategies
2 min readRead Guide →
 money
money5 Fall Trips That Are Even Better After You Retire
5 min readRead Guide →
 money
moneyThe 'Ultra-Low-Risk Portfolio': A Good Choice for Wary Retirees?
2 min readRead Guide →
 money
moneyWhat Happens When You Inherit a House With Your Siblings: A Practical Guide
4 min readRead Guide →
Benchmarked MONEY Solutions At a Glance
Evaluated for performance, privacy protocols, and pricing transparency.
| Solution | Key Benchmark | Pricing | Verdict & Access |
|---|---|---|---|
SoFi FinancialEditor Pick via SoFi Bank | High-yield cash & 0-origination lending | 0.00% Fees | |
TradingView via TradingView Inc. | Institutional multi-asset charting | Free / $14.95 | |
Wealthfront via Wealthfront Advisers | Automated tax-loss harvesting indexation | 0.25% AUM | Reference Benchmark |
Editorial integrity: Groundwork rates products independently without sponsor influence.More Comparisons →
Written byLead AnalystPrimary Research
David Sterling
Finance Analyst
Lead Financial Modeling FellowQuantitative Economics SpecialistFixed-Income Analyst
David Sterling leads the Money & Wealth Strategy Desk at Groundwork. He specializes in macroeconomic rate regimes, fixed-income mathematics, mortgage amortization economics, and tax-advantaged asset accumulation. Drawing on extensive quantitative modeling experience in institutional asset allocation, Sterling builds Groundwork's mortgage refinance break-even engines and debt optimization models, providing empirical clarity free from commercial product bias or lender sponsorship.
Fact-Checked byReview BoardIndependent Audit
Elena Vasquez
Editorial Director
Elena Vasquez serves as Lead Investigative Editor at Groundwork, overseeing quantitative data integrity, algorithmic verification models, and multi-vector consumer research across all five editorial pillars. With over fourteen years of experience in systems engineering and computational journalism, she specializes in uncovering hidden commercial incentives, auditing algorithmic bias, and translating complex regulatory filings into transparent, actionable guidance for household decision-makers.
Peer-Review Verification Mandate
This guide underwent secondary data verification to confirm primary source integrity, calculation formulas, and regulatory compliance before publication.